In addition to all of the above, version 0.17 continues to refine existing QGISRed features. For example:
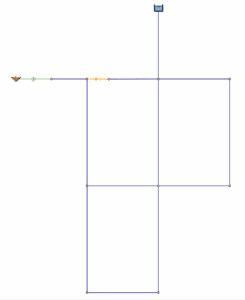
- Nodes with assigned base demand are now filled in orange.
- The symbol of contaminant sources changes color according to their type.
- All layers display the number of elements they contain.
- Hovering the mouse over any element in the active layer displays its ID.
- Layers in the Input group are automatically reordered to maintain visibility.
- When distributing demands to nodes, pump and valve endpoints are excluded.
- Pump curves defined by three points are now extended to the entire quadrant.
- Minor errors related to modulation curve handling have been fixed.
- Errors in the option to assign demands proportionally to pipe length have been corrected.
- Some automatic messages that were annoying have been removed.
Various corrections have been made in reading the INP file, etc. If you want to learn more about all the minor improvements and fixes introduced in version 0.17, visit the change log below in the Version History section.