Presentation

Welcome to QGISRed. On this page you will find everything you would probably want to know when you first get in touch with this product: What is it and what are its objectives? How did it come about? What is it for? How can I install it? Who are the people behind it?  I encourage you to visit the following sections of this page to answer all your beginner’s questions.

If you want to learn more about the product’s capabilities and its current state of development, how to use the application, the publications where the basics are explained, or how to connect with us to get support or collaborate in this exciting project, visit the other sections of this website. Oh, and you can also register to be permanently informed about the latest news.

What is QGISRed

QGISRed is a QGIS add-on (or plugin) intended to facilitate the task of building and analysing hydraulic models of water distribution networks, from the simplest schemes to the level of detail required by Digital Twins. 

The plugin is free to use and takes advantage of all the benefits of working in a GIS environment to georeference the network elements, superimpose them on geographic backgrounds, edit the graphic and alphanumeric information, visualise the information by layers, customise the symbology, carry out geoprocessing operations, etc.

Unlike other plugins, QGISRed is not a set of isolated tools to facilitate certain tasks, but a working platform from which you can build or import the network model, edit its layout, declare the properties of the elements, build a calculation scenario and analyse the results, all from the same environment. In this way QGISRed can emulate all the capabilities of EPANET 2.2, extending its editing and calculation options.

In addition to this, QGISRed offers some aids for the creation of models, such as the verification of all data, the automatic calculation of lengths, the interpolation of dimensions from a DTM, the assignment of roughness to pipes based on material and age, the assignment of demands to nodes based on population data or average recorded consumption, and the management of calculation scenarios. 


As an advanced modelling tool, QGISRed offers additional options to extend the model and connect it with real data, thus progressively converting the hydraulic model of the network into a Digital Twin. For example, through connections, billing or remote reading data can be uploaded to the model, and through sensors, field measurements can be compared with simulated values. Shut-off valves can be used to isolate closed valves for maintenance operations or to temporarily or permanently sectorise the network. With access to real data, it is possible to carry out water balances, obtain performance indicators (or KPIs), etc.

Emulating EPANET’s capabilities accelerates the learning curve in the use of QGISRed. In addition, the knowledge of QGIS required for its use is minimal, as proprietary tools have been developed to carry out all the necessary operations. However, QGIS specialists will be able to get even more out of the features offered by QGISRed.

This site offers numerous aids to become an expert in network modelling in a short time, and to offer professional solutions to companies using the tools associated with the Digital Twin. 

Finally, it should be noted that the data model used by QGISRed is public and with a very simple structure, mainly oriented to carry out all types of analysis, which allows QGISRed to be connected with other network modelling applications such as EPANET, InfoWorks or WaterGEMS.

QGISRed (pronounced as Koo_his_rred following the Spanish phonetics) is currently only available in English, and will soon be available in Spanish as well. It could potentially be offered in the more than 40 languages supported by QGIS.

Background

The idea of enhancing EPANET’s features by connecting it to a GIS is not new to our research group. Back in 2004, Fernando Martínez, director of the current QGISRed project, led a project with similar objectives and features, called GISRed. There were two versions at the time, 1.0 and 2.0, and its capabilities were disseminated through various publications.

GISRed was programmed in the Avenue language for ArcView 3.2, a forerunner of what later became ArcGIS, and came to be configured with more than 600 scripts.  It was used internally as a tool to assist in the development of several supply improvement master plans, including the supply to the city of Valencia and its metropolitan area, with a population served of 1.5 million inhabitants, as the most important milestone.

Below are some screenshots of that application. 

However, the lack of robustness of the product limited its diffusion in the first instance, and soon ArcView became obsolete, and the Avenue language was also abandoned.

In the following 15 years no application, apart from commercial products, came close to providing the features that GISRed offered to assist in the modelling of supply networks. In the meantime the EPANET code was released, and in 2015 a section was founded within Open Water Analytics (OWA) to further develop the EPANET calculation module (also known as Toolkit), with the contribution of the entire research community. Finally, in December 2019, the latest version 2.2 of the Toolkit was launched from this platform, which is still valid today. Shortly afterwards, in July 2020, the EPA also upgraded the EPANET graphical interface to version 2.2, in which it integrated the latest version of the Toolkit.

However, these developments in EPANET did not enhance the modelling support tools, nor did they add new types of elements to the network. They were basically limited to making all scenario data accessible to programmers and offering the option to use the function library in concurrent mode, the major contribution being the possibility to run models with pressure-dependent demands (PDA). 

The challenges of the old GISRed were still present, so in 2018, following the spectacular advances of the free QGIS software, we decided to reproduce the features of GISRed in this new environment, and to improve the features of that initial product, bringing them up to those offered by the latest version of EPANET 2.2.  The first public presentation of the new product, now called QGISRed, took place at the 2019 CCWI Conference in Exeter (UK).

On the other hand, the experience gained by the authors in the development of one of the first Digital Twins in the world for the city of Valencia, led us to further enhance the features of the new plugin to allow migrating from a conventional hydraulic model to the construction of a Digital Twin.

The result of this effort is the QGISRed product presented here, with the intention of marking a milestone among the free-use products aimed at facilitating the construction of water distribution network models, which will be increasingly required by the companies managing water supply services for decision-making, at a time when the digitalisation of this sector is beginning to run rampant.

QGISRed is still under construction, and the features of the latest official version can be consulted in the CAPABILITIES section, where the latest developments and future features to be developed are particularly detailed. All the objectives proposed in the roadmap for the free version of this product are expected to be completed within a year at the latest.

Applications

We would not have made all this effort if the use of simulation models were not increasingly required and necessary. Distribution networks become complex systems to manage over time, due to their continuous expansion and adaptation according to the needs. On the other hand, their highly non-linear behaviour, due not only to the pipe loss equation, but above all to the operating mode of the regulation elements, with continuous starts, stops and changes in the set points, mean that the intuition of the network operators when estimating their behaviour often fails on numerous occasions.

The models were initially used for design purposes by simulating the most unfavourable case, usually the peak situation, on a simplified network. Over time, their use was extended to simulate the dynamic behaviour of networks in operation, normally for a typical day, seeking in principle to reproduce the variations in level in the reservoirs, or to determine the extreme values of pressures, flows and velocities throughout the day, and their use was finally extended to make predictions on the evolution of the quality of the water as it is transported through the network.  Today, models are asked to faithfully reproduce the behaviour of the network at any instant in the past or present, and to predict its short-term behaviour through digital twins.

QGISRed aims to cover all these situations, the main applications being each case:

In any case, it should be made clear that the free version of QGISRed is not going to offer solutions to all these problems, nor is it intended to do so.  QGISRed merely simulates the behaviour of the network under predefined conditions, as EPANET currently does. It just offers many more modelling tools, more types of elements, and allows the model to be connected to real data.

While reproducing reality is a verifiable challenge, providing solutions to many of the problems encountered involves taking into account the judgement of those responsible for managing the network. The solution in these cases is not unique, and often optimisation or artificial intelligence techniques are used to reach feasible solutions. These techniques are currently outside the scope of the free version of QGISRed.  On the other hand, the user will be able to check with the product that offers the answer to any given situation, which is already an important step forward. Consequently, the engineering criteria and the know-how of the experts are still of great value in offering the right solutions to these problems.

Installation

QGISRed is not a stand-alone desktop application that you have to download first and then install by running the downloaded file. Nor is it a web application that you download when you run it. 

QGISRed is a QGIS add-on, and therefore it is required to install the desktop version of QGISRed from the official website https://www.qgis.org. Users can install the most recent version for Windows, although it is also compatible with older versions.   

QGIS is the most widely distributed free GIS software in the world today, and offers in its latest versions an innumerable list of features, including interoperability with all types of environments and data formats. It is available for Windows, macOS, Linux, BSD, mobile and tablets. However, QGISRed currently only works on Windows and for versions later than 3.2. In addition, although QGIS can support up to 40 languages, QGISRed is currently only available in English.

Once QGIS is installed, to install the QGISRed add-on, simply follow the steps below:

  1. From the Add-ons menu, choose the Manage and install add-ons option.
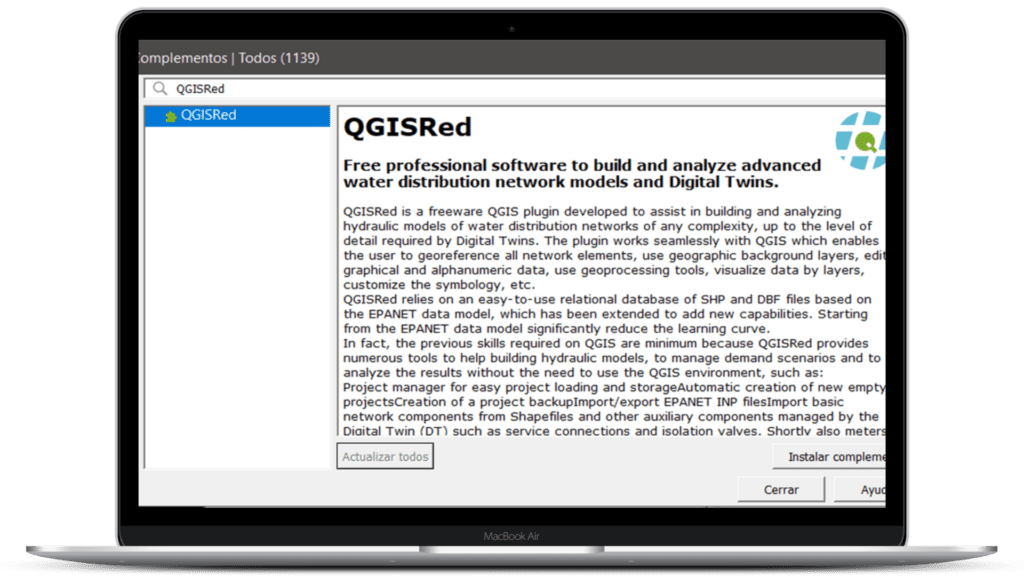
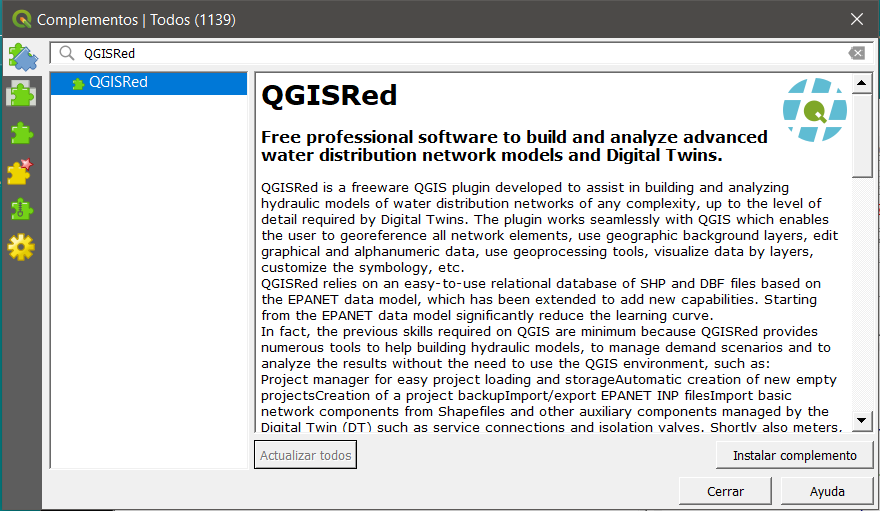
  2. From the All tab, search for the QGISRed plugin by its name, and then the following screen should be displayed, as it is a plugin registered in the official QGIS repository
  3. Click on the Install Add-on button, and in a matter of seconds the application will be installed. Finally close the window.
  4. The new QGISRed menu will appear in the menu bar.

    and the new QGISRed button bar will also be displayed in the button bar,

    from where alternatively all QGISRed features can be accessed.

  5. One last step is missing. As soon as you try to use any QGISRed option for the first time, a new screen will appear asking you to complete the installation with the libraries (dlls) that contain all the algorithms that configure the QGISRed core. It is only a few seconds more.
  6. This has completed the installation of an application that will surprise you with the numerous features added to those already offered by QGIS, all of them oriented to the creation and exploitation of hydraulic network models.

There are currently more than 1100 active QGIS add-ons registered, but only half a dozen are related to water networks. Among them, QGISRed is the one that offers the most features today.  If you open the QGISRed add-on window again, you can see a summary of its features, the number of current downloads and its rating.

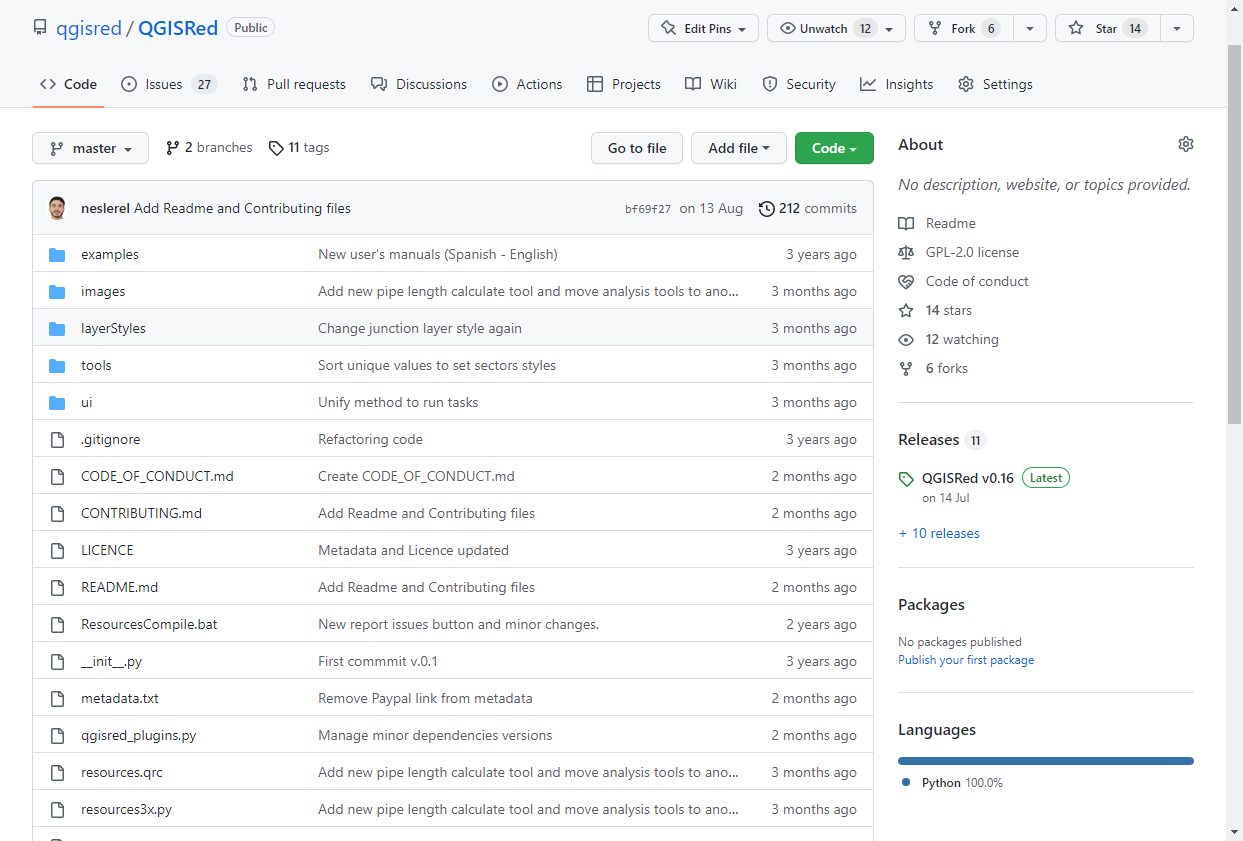
In the same window you have a link to the QGISRed tab of the QGIS repository (you can also get there by clicking here), where you will find some more details, and the version history since September 2019 when the first version of QGISRed was uploaded to the repository. Clicking on them you can see what’s new in each one.

QGIS also allows you to install interim beta versions through the Install from ZIP tab in the same installation window, but this is reserved for contributing users. 

Every time a new official version is released, a pop-up message will be shown informing about its existence, which will take the user to the QGIS plugins repository to know the news, although you will also find them in this web. 

In addition, from the QGISRed plug-in window itself, the user will be invited to update the current version. Just click on the button at the bottom of the Update Add-in window, which will be activated, to automatically replace the previous version with the new one in a matter of seconds. Then, when you click on any QGISRed button, you will be prompted to update the libraries as well.

Finally, if you want to know which version of QGISRed is currently installed, just read it in the plug-in window itself or by clicking on the About QGISRed menu option.

GitHub project

QGISRed is not a closed product. The part of the QGISRed code that interacts with QGIS functionalities is developed in Python and is in the public domain, according to the terms of the QGIS GNU GPL 2.0 licence, which is extensible to all plugins distributed through its official repository.  

This code is accessible through the GitHub portal QGISRed and hosts all the functionalities that affect the customisation of the QGIS graphical interface after installing the plugin, as well as certain editing and selection capabilities of the network elements. 

Below is the content of the tab that hosts the QGISRed code. From the last two lines you can also access the manuals in Spanish and English

The QGISRed project is in its first phase of implementation, and for now the development of the free code is not collaborative, although it is planned to open it to the research community in the future.

On the right hand side of this tab you can also see the plugin licence, the latest released version and all previously released versions with their improvements.

A very important section of this portal is the Issues tab, which is fully active, and where users can report any issues.  It is divided into two sections, one for Open issues (most of them are suggested improvements for the future) and another one for Closed or resolved issues, which are all those that seriously affect some functionality of the application.

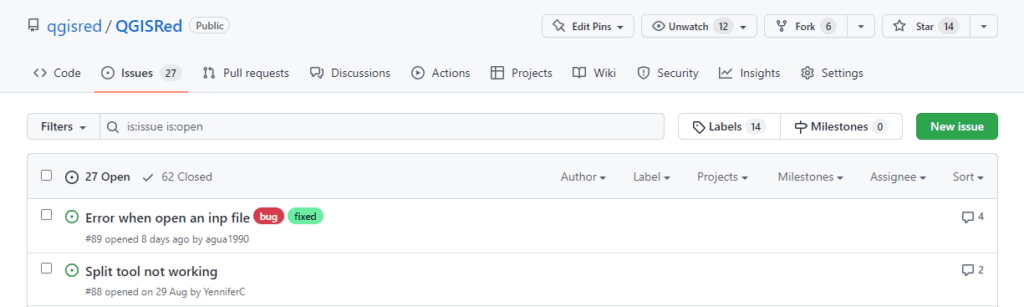
In order to create a new issue, users must first register on GitHub, via the Sign up button in the top band, and then follow the instructions. They can then create a new issue from the New Issue button, or respond to open issues raised by other users.

Also in the future we will host in the Wiki tab of this portal an open and collaborative version of the application manuals, both in English and Spanish.

However, most of the QGISRed code is developed in C# for Windows, configuring a series of libraries called GISRed.xxx.dll, which are used by the graphical interface. These libraries contain most of the algorithms, forms and dialogue boxes of the application, and are installed in the folder …/AppData/Roaming/QGISRed/dlls/… of the user’s profile when clicking on any button or option of the plugin, once installed. All the algorithms contained in this library have been developed from scratch, and do not use any other external library, nor the QGIS libraries, thus not generating any dependency, except with the Epanet2.dll library corresponding to the EPANET Toolkit 2.2 (Dec 2109), used to launch the hydraulic and quality simulations, and the Shaplibe.dll library used to read and write the .shp files; both libraries are installed at the same time as the QGISRed libraries. On the other hand, the Python dialogues have been built using the Qt platform, which is also in the public domain.

Credits

The QGISRed project is an initiative of the Research Group on Hydraulic Networks and Pressure Systems (REDHISP), of the Institute of Water and Environmental Engineering (IIAMA) of the Polytechnic University of Valencia (UPV), as a proposal to retake the features of the old GISRed application and adapt them to a more modern working environment, while promoting its dissemination worldwide.

The project starts with a grant from the Generalitat Valenciana for the hiring of Technology Transfer Support Staff (APOTI/2018/006), for an effective amount of 18,300 € and duration from Nov 2018 to July 2019. From that date onwards, the project continues to move forward through collaboration with the economic support of the REDHISP group’s R&D Sustainability Fund, fed with its own resources generated through contracts and the collaboration of the company WaterPi until the end of 2022.

The QGISRed Project is led by Prof. Fernando Martínez Alzamora, Professor of Hydraulic Engineering at the UPV, with more than 40 years of experience in the modelling of pressurised hydraulic systems.  A brief CV is attached, while a list of his main publications can be found on his personal Research Gate page

Fernando Martínez Alzamora holds a degree in Industrial Engineering from the Universitat Politècnica de València (1978) and a PhD from the same university (1982). Since 1995 he has been Professor of Hydraulic Engineering at the UPV and since 2001 researcher at the Institute of Water Engineering and M.A. (IIAMA) of the aforementioned University. 

He teaches in the area of Hydraulic Machines and their industrial applications, including the use of renewable energies through Hydroelectric Power Plants and Wind Farms. He has also taught subjects in doctoral and master’s degree courses on the Modelling of Hydraulic Networks and the use of Geographic Information Systems (GIS). 

His research has focused on the analysis, design and operation of water distribution networks, both for urban supply and pressurised irrigation. In particular, he has worked on the improvement of simulation algorithms, the integration of hydraulic models in GIS for the realisation of master plans, and the use of models in real time for decision making, in connection with SCADA systems. On these subjects he has published 40 articles in prestigious journals, 70 communications at national and international conferences, and supervised 11 doctoral theses. He has been principal investigator of 12 national research projects and participated as team leader in 4 European projects of the framework programme.


He collaborates assiduously as a consultant or in the development of contracts with companies in the water transport and distribution sector, having been responsible for a total of 62 contracts to date. He has also developed several software applications such as SCARed for the real-time control of the water supply network in Valencia and its metropolitan area, operational for more than 10 years, GO2HydNet to obtain updated hydraulic models by direct consultation of the corporate databases of the water management companies, or QGISRed, a free application on QGIS for the creation of advanced models of pressurised water networks and Digital Twins, in connection with real data. He has also participated in the development of HuraGIS for the optimisation of water and energy use at plot level in pressurised irrigation networks.

Since 2001 he has been responsible for the research group on Hydraulic Networks and Pressurised Systems (REDHISP) at the Institute of Water Engineering and M.A. (IIAMA), of which he was Director/Deputy Director from 2008-2013. He has also been Coordinator of the PhD Programme in Water Engineering and MA of the UPV, in the period 2013-17.

The QGISRed code was developed until the end of 2022 by Néstor Lerma Elvira, Dr. Ing. Caminos by the UPV, and founding partner of the company WaterPi Coop. V. Much of the merits of the version of QGISRed offered here are due to the good work of Néstor, who has been able to combine his engineering knowledge with his skills as a programmer. You can visit his research profile on the Research Gate personal page

Néstor Lerma Elvira holds a degree in Civil Engineering from the Universitat Politècnica de València (2010) and a PhD from the same university (2017). During the period 2009-2017 he specialised in water resources, applying evolutionary algorithms to optimise the management of multi-dam systems in the same final project, the final project of the Master’s degree in Hydraulic Engineering and Environment (taught at the same university) and the aforementioned PhD.

However, he combines this experience with a passion for developing applications for users, which began in the early years of his career and continues to this day. The programming languages he has mostly used are c# and vb.net, although he has also developed other applications in python or typescript/javascript, apart from having knowledge in SQL, VBA and R. 

During his time as a researcher, he was already collaborating in several software applications for the Water Resources Group of the Universitat Politècnica de València, from its most well-known programme, AQUATOOL, used in most of the Hydrographic Confederations, to other tools that complement it, such as EvalHid, Caudeco, MashWin, Aquival, etc. This stage also allowed him to collaborate in another international application such as RS Minerve. This software is being developed by the Swiss research centre CREALP and the engineering office HydroCosmos S.A. in collaboration with two universities (Ecole Polytechnique Fédérale de Lausanne and Universitat Politècnica de València) and the Hydro10 association.

From 2018 he founded his own company (WaterPi) dedicated to engineering consultancy applied to water resources management and environmental projects, although he also develops various applications for several companies.

It was in that same year when he joined the research group led by Fernando Martínez Alzamora and started programming what is today QGISRed, starting a new specialisation in the field of pressurised water distribution networks. After a very fruitful year in which the foundations were laid, he continued to collaborate actively in the development of QGISRed through WaterPi.

In addition to other projects he is involved in at WaterPi, he combines his time with another company dedicated to the creation of a digital platform for integrated water management, advising, researching and developing the application itself.

QGISRed v1.0 is registered in the CARTA services of the UPV, with the registration number S-072-2021, and GNU GPL 2.0 license, being 100% owned by the UPV.  The download and use of the plugin is free, without requiring any type of prior registration. However, any professional or educational use of the plugin must mention its origin and provide a link to this website.  

However, users who voluntarily want to register to keep up to date with the latest news or contact the developers can do so from our contact form.

Although the results provided by QGISRed have been checked on several occasions against those provided by EPANET 2.2, the authors of the plugin decline any responsibility for the accuracy of these results and the use made of them.