
Capabilities
After the Presentation, you will be curious to know what capabilities the QGISRed plugin offers to the user. In this section, we will present them to you. However, since this is a product still under development and was started a few years ago, we will do this in stages.
First, we will introduce you to the Latest features of the most recent version. Then, we will highlight the Most important features that have already been developed, so you do not have to discover them in the manual. If you prefer, you can see all the implemented features in the Current Capabillites section. Finally, we will give you a little taste of Future versions. And for the very curious, we have reserved the last section, where you can see how the product has evolved since its launch and what improvements have been introduced in each Version.
To give you a better idea of the numbering of the versions, be aware that all current versions start with 0, as the product is still under development. The goal of the first version of QGISRed is to complete all the planned improvements over what EPANET 2.2 currently provides, complete the additional capabilities to facilitate the construction of the model, and complete the extension of the model with all the necessary additional elements and their functionalities until we can reproduce the real behaviour of a network for any period of time associated with the field data, as a Digital Twin.
At that time, we will launch version 1.0 and open the doors to add more practical and professional features to the product. In the meantime, we are at version 0.16 and we estimate that we will need about 5 more versions to achieve all the planned goals. Basically, we still need to complete the introduction of data to make it more agile and powerful, add some more parameters to the components, improve certain aesthetic aspects, increase the agility and the alternatives in displaying the results and complete the whole casuistry to reproduce reality with greater fidelity, which may include adding some more components in the Digital Twin part.
But enter, enter the following sections and you will learn all this in detail.
What's new in version 0.18
This new version 0.18 of QGISRed incorporates many of the advances made over the last three years since version 0.17 was completed, even though the release of the latter was delayed until recently.
The momentum gained in recent years has been thanks to the collaboration established with the Inter-American Development Bank (IDB), which has relied on QGISRed as a free tool for analysing solutions for the water supply improvement projects it funds.
Some of these improvements have been rolled out through beta versions 0.17.1 to 0.17.4, released on the QGISRed GitHub platform.
The following sections highlight the most important new features of version 0.18.
For a more detailed description of all the new features, please visit the Version History section.
Improvements to the storage of results and their display on the map
. . Up to version 0.17, the results of a simulation were saved in a dedicated file from which the various shapefiles associated with each variable were configured. The rows of the attribute table represented the network elements, and the
Time Series of dynamic variables
. . One of the features most sorely missed in QGISRed was the ability to display the temporal evolution of any of the dynamic variables contained in the results. This is a very useful and common query, offered by most
Creation of thematic maps
. . If we want to view on the map the values of a specific calculated variable for all elements in the network at a given moment, categorised by colour or as labels, we can use the results panel to
Identifying elements by their ID
. . When we look at a network map, we can easily distinguish one element from another. However, sometimes elements may overlap, even though they are actually different. The only way to distinguish them definitively is to assign them a
Properties of the elements
. . Thematic maps and the results panel allow you to display the values of any selected property for all network elements on the map, or to colour-code them. But what if you want to view all the properties for
Queries by properties
. . Using thematic maps, we can display the value of a specific property for all elements on the network map. The same applies to simulation results, where the results panel can be used to select the variable to be
Legends Editor
. . One of QGIS’s most important features is its ability to edit layer styles and generate a wide variety of maps. However, the sheer number of options available can be overwhelming. To simplify matters, QGISRed has introduced a new
Miscellaneous and debugging
. . In addition to all of the above, version 0.18 includes many other minor improvements. We have also continued to refine the features offered by QGISRed in previous versions. Highlights:
In this section we want to highlight the most outstanding capabilities of QGISRed, in what we have developed so far. Although the Manual reflects all the capabilities of the application, it is not always pleasant to read. On the other hand, from here we can tell you the motivation, peculiarities and scope of each of the highlighted capabilities.
As there are many of them, we have sorted them by subject. In addition, we will gradually complete them as we have more content. As in the News section, in the following files we only intend to give an introduction to each highlighted capability in order to motivate you and awaken your interest. For more in-depth information, we will refer you to the tutorials and videos, and ultimately to the Manual.
New Tool for changing the Status of Elements and Symbolisation according to their Status
One of the most common operations in modifying a simulation scenario is to change the status of the network elements, whether they are regulating elements or not, from open to closed or vice versa. To facilitate this task, QGISRed includes

Improved Navigation from the Property Editor
The QGISRed Properties Editor opens a window where you can change the properties of the selected element, regardless of its type. It is not necessary to have previously selected the layer corresponding to this element, as is the case with
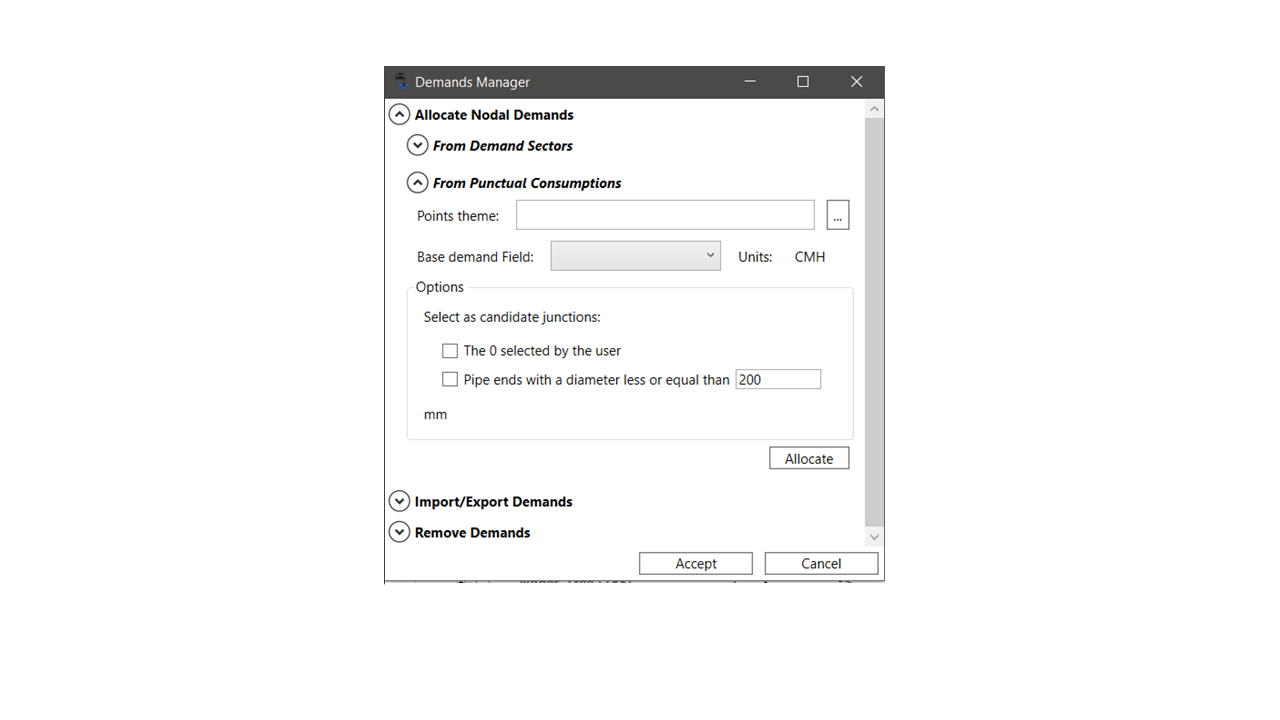
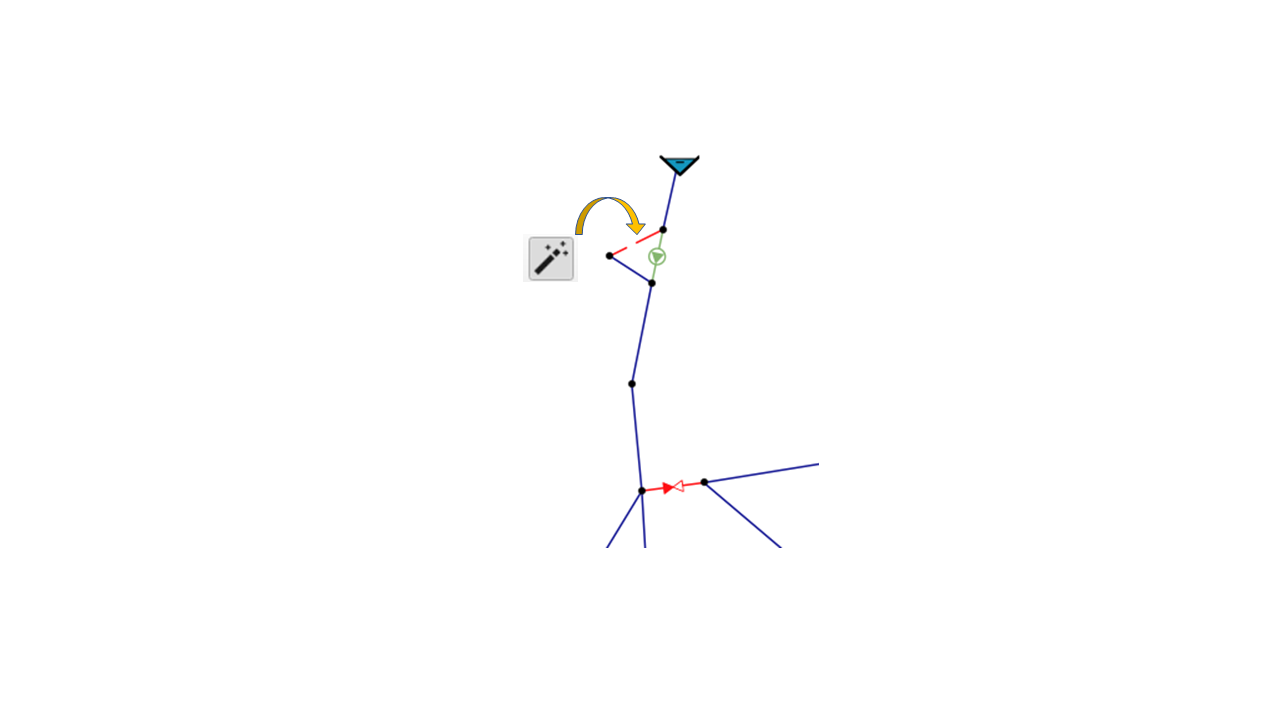
Allocation of Demand to Nodes by Sectors and from Consumption Points
The allocation of demands to the nodes of a network cannot be done individually when there are a large number of nodes. It is also not practical to assign them as a group, since each node usually has a different
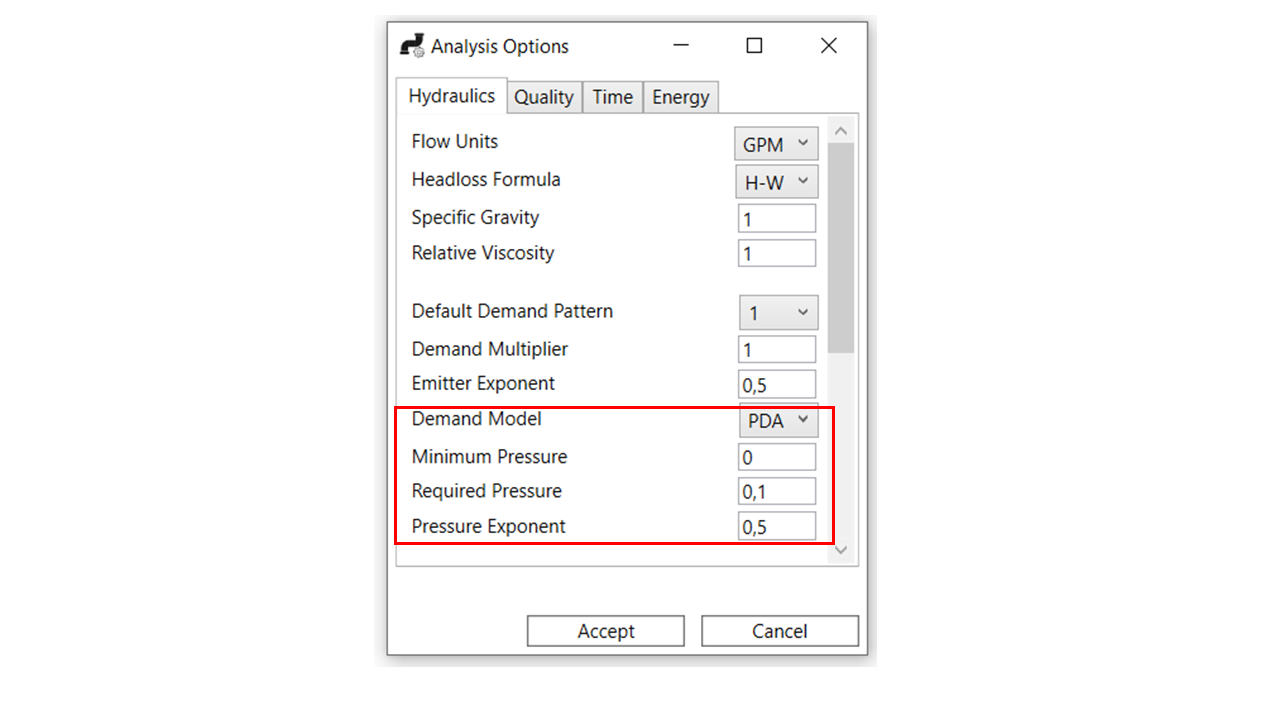
Support for New EPANET 2.2 Analysis Options
One of the most important contributions of version 2.2 of the EPANET library is the ability to consider pressure-dependent demands (PDA), as opposed to the option of considering them fixed (DDA), to approximate the behaviour of the network under insufficient
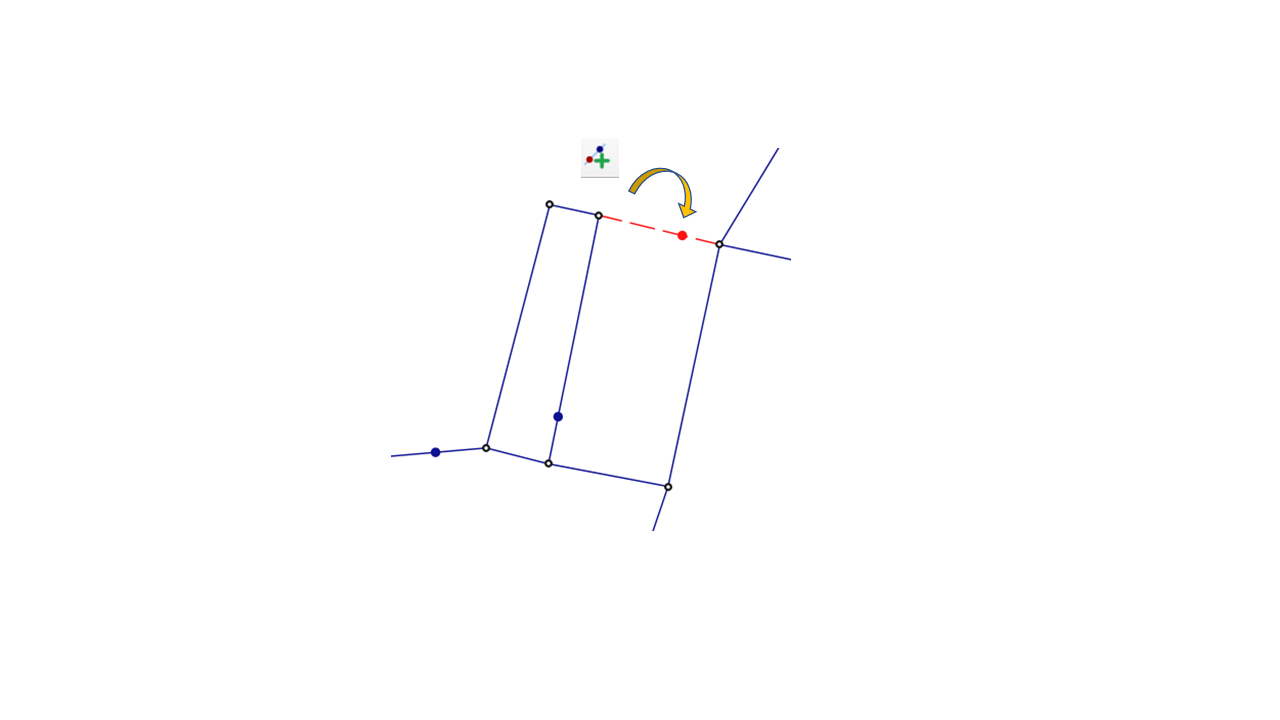
Incorporation of Isolation Valves into the QGISRed Model
If you want to use the network model to analyse how flows are affected when sectioning the network by isolation valves, either to permanently separate zones or to isolate a zone while a maintenance task is performed temporarily, you must
Current capabilities

QGISRed is now almost four years old, having been launched in late 2018. Since then, we have not stopped rolling out improvements, though perhaps not at the pace we’d like because we have not been able to focus exclusively on them during that time. But looking back, the features that the latest version already offers are pretty remarkable.
Some of these features are described in more detail in What’s new, or in Featured Capabilities, but to learn more about other features you’ll have to consult the Manual, or the Tutorials and Training Videos we are gradually developing. You can also sign up for our on-site or virtual Courses, which are still under development.
Below, we list the main features already offered by the latest version that you can download through the QGIS plugins installer, which we have sorted by topic for clarity.
- Project manager for easy loading and saving of different projects
- Automatic creation of a new empty project
- Automatic creation of a project from an INP file
- Cloning projects and creating a backup copy
- Editing the metadata and properties of the project.
- Summary of project characteristics
- Management of model layers
- Declaration of default values
- Declaration of model options
- Automatic creation of nodes when laying the pipes.
- Automatic creation of topological relations between all elements whenever necessary, without the user having to do it
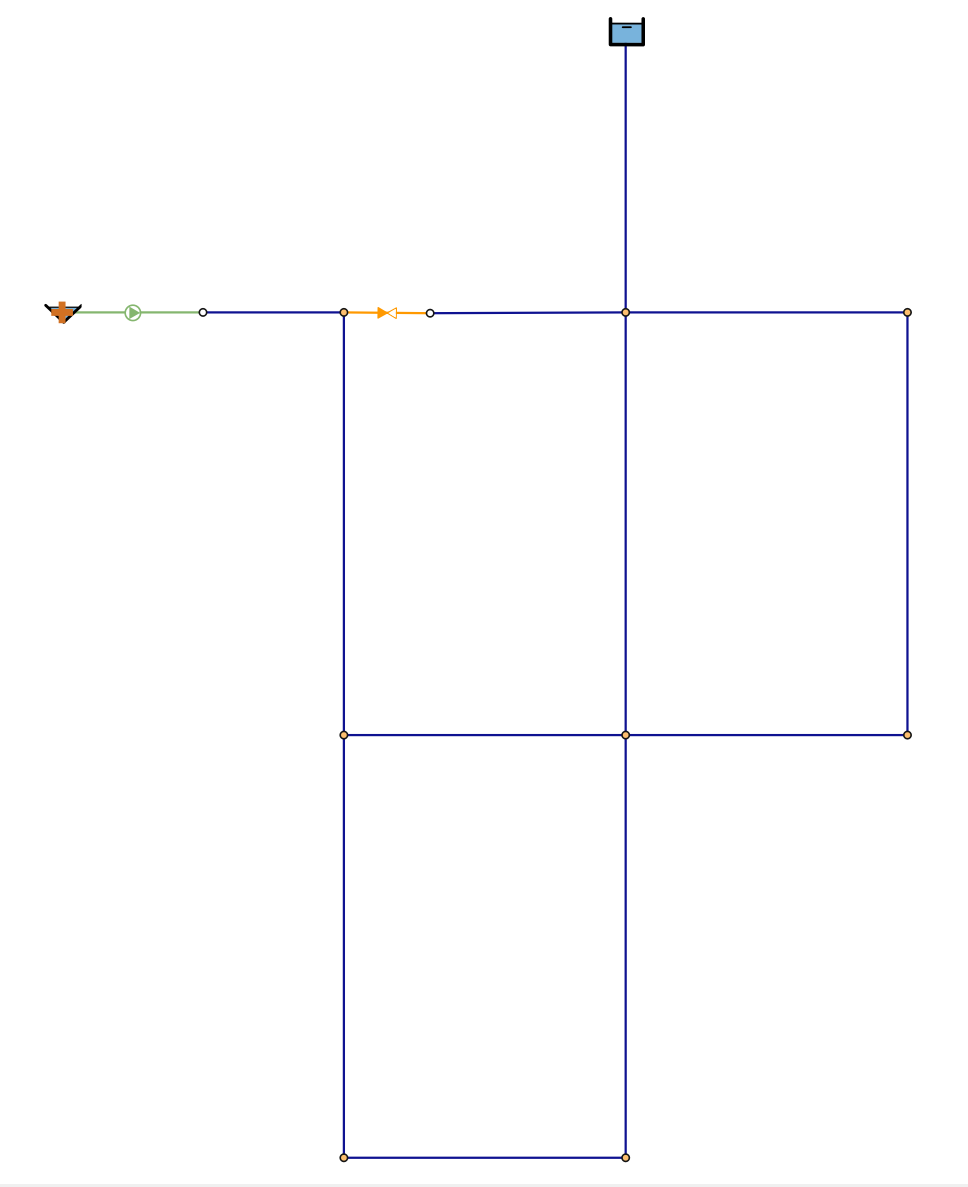
- Insertion of valves and pumps as linear elements at intermediate points of pipelines or at nodes
- Tools for graphical editing of all basic elements of a network (creating, deleting, moving and editing the layout)
- Tool to automatically reverse the routing of pipes, pumps and valves
- Tool for changing the status of pipes, pumps and valves when touched
- Assignment of default properties when creating new elements
- Special windows for editing properties of all basic network elements
- Search for elements by element type and Id identifier
- Navigator to visit elements associated with the current element or to revisit elements already visited
- Selection of multiple elements by region for further processing
- Treatment of multiple demands as an independent layer, integrating the processing of their properties with those of the nodes
- Recognition of emitters as discharges to the atmosphere according to an exponential law
- Treatment of pollutant sources as an independent layer, integrating the processing of their properties with those of the nodes
- Automatic recalculation of pipeline lengths according to CRS
- Automatic interpolation of nodal elevations from a DTM
- Automatic estimation of pipe roughness from pipe material and age
- Conversion of roughness coefficients between different loss formulas and unit systems
- Automatic assignment of demand to nodes from the consumption per sector or at service points
- Correction of demand with the hydraulic efficiency by sectors
- Assignment of demand patterns by sectors
- Wizard to create scenarios with multiple demands, classified by categories
- Advanced editor for patterns and element curves
- Advanced editor for simple and rule-based controls
- Complete import of all data from a EPANET INP file. Error detection
- Import of basic network elements from shape files (SHP). Field matching
- Additive import of components from shapefiles
- Import/export of patterns and element curves from the corresponding editors
- Export of all current model data to an INP file for further analysis from EPANET, including field data if available
- Detection and removal of overlapping elements
- Simplification of line drawing with aligned vertices
- Splitting of pipes by creating intermediate nodes
- Merging of adjacent pipes with the same properties
- Merging and splitting of junctions
- Creation of T-connections, or disconnection if needed
- Resolution of line crossings by creating intermediate nodes or cancelling them
- Verification of connectivity of all elements of the network
- Verification of validity range for some properties of the elements (lengths, diameters, materials and data)
- Identification of the different hydraulic sectors and their classification according to the applied demand and supply sources
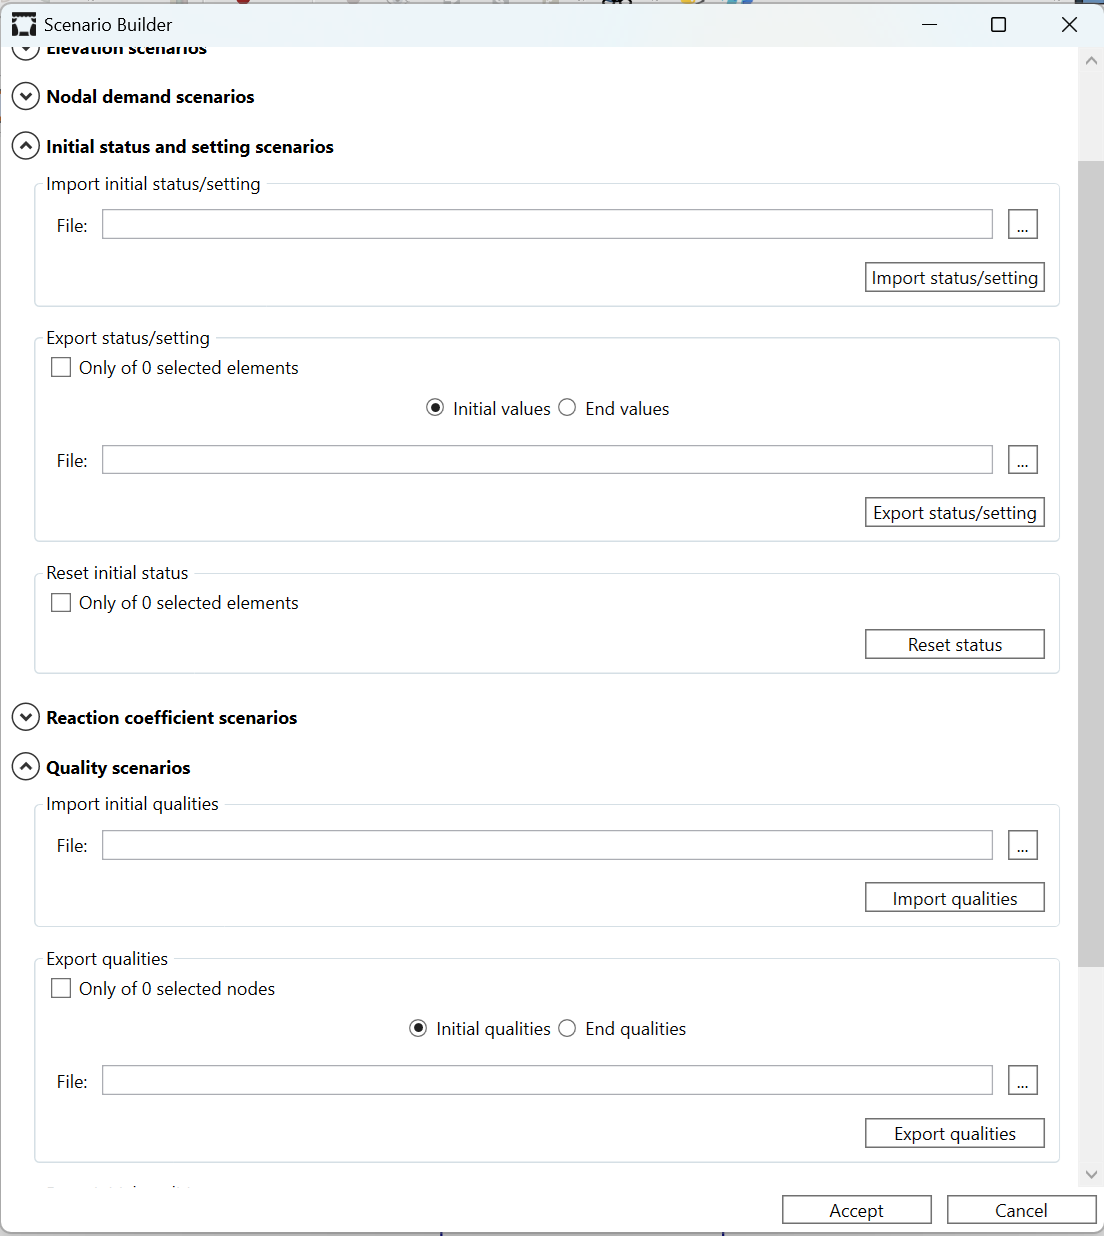
- Wizard to manage data scenarios by changing diameters, roughnesses, elevations, demands, initial status, initial qualities, reaction coefficients or contaminant sources
- Creation of combined scenarios by modifying several magnitudes at the same time
- Specific window to edit all Analysis Options, sorted by category
- Connection to EPANET Toolkit 2.2 to carry out simulations. Recognition of all functions
- Storage of simulation results in an own data structure
- Visualisation of the results in colour maps by magnitude, selectable from the results panel
- Automatic definition of legends and symbology for viewing the results, revisable from QGis
- Option to show the flow direction by arrows
- Option to display the numerical results of the current magnitude as fixed or floating labels
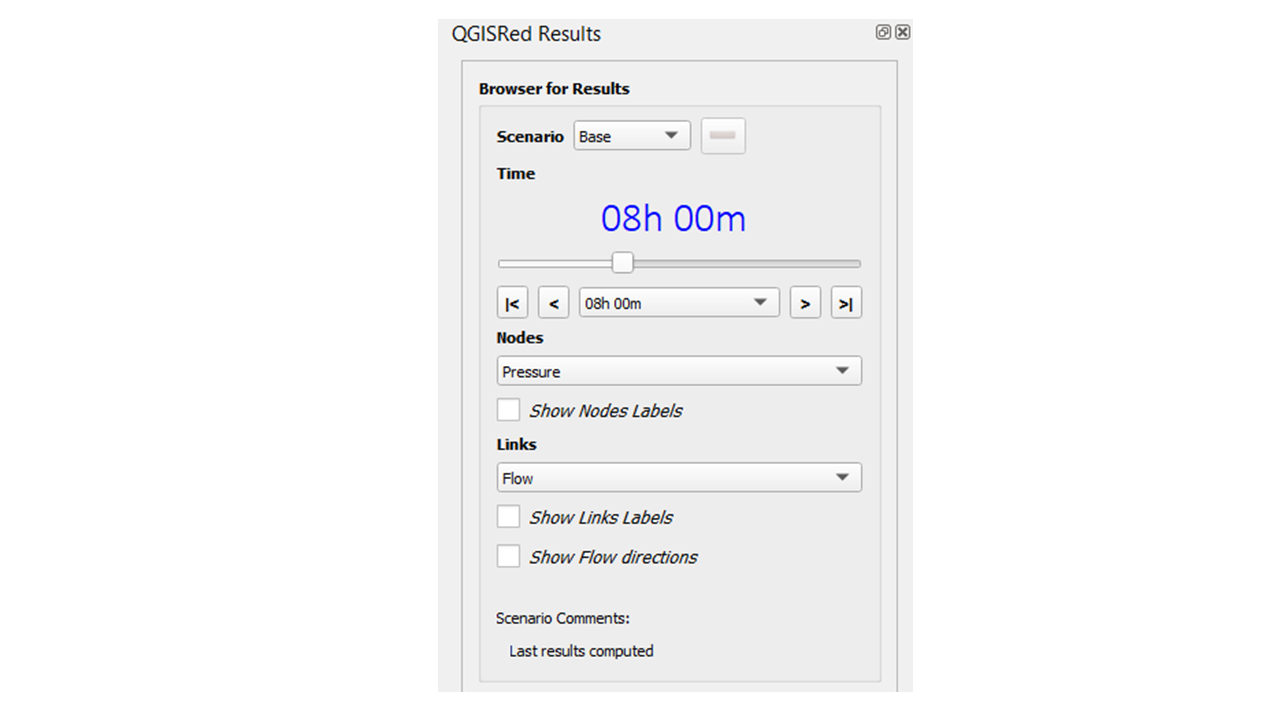
- Navigation bar to observe the evolution of the results over time, for the simulation interval
- Editing and handling of service connections as differentiated elements for loading demands to the model
- Import of service connections from shape files and integration in the Property Editor
- Wizard for automatic routing of service connections by means of perpendiculars to pipes or by connecting them with nodes and vertices
- Automatic loading of meter readings to service connections and automatic transfer of demands to model nodes
- Optional integration of service connections into the hydraulic model as pipes or nodes
- Editing and handling of isolation valves as differentiated elements to control the flows
- Import of isolation valves from shape files and integration in the Property Editor
- Automatic transfer of the isolation valve status to the pipelines
- Identification of segments closed by isolation valves and cancel of demandas on them
- Declaration of different types of meters, and automatic association to network elements
- Importing meters from shape files and integrating them into the Property Editor
- Declaration of the signals taken by each meter and their linking with the data coming from SCADA or data-loggers
- Import of field measurements and comparison with simulated values from the EPANET environment
- Creation of a project repository to store the consumption records and SCADA signals or data-loggers by now
- Loading the model with field data for any time interval in the past, within the range covered by the repository.
- Identification of basic demand sectors, taking into account closed valves and location of flow meters
- Mapping of the minimum resistance tree of the network, with configurable parameters to identify priority waterways
- Information window about the installed version, with some basic links and credits
- Button to access directly to the GitHub development environment to report issues
Road map
As you know, QGISRed version 1.0 is still under development. Below is a list of the main improvements that we plan to incorporate to complete this version. The attached list is not closed, and may be subject to change.
- Complete some of the Project Manager options.
- Review the default options, and differentiate them at code, user and project level.
- Integrate the DTM and the roughness table in the project specifications and dynamise their use from the Property Editor.
- Complete the Options at Project level (modes to assign roughness, …)
- Add some additional properties to the current elements.
- Complete the data model
- Make editable the roughness table by materials and age.
Develop a unit converter for all the data.
Import CAD files
- Develop a tool to move overlapping elements on the network layout.
- Develop tools to clone elements and copy their properties
- Add an element search by ID from the Edit Menu
- Develop an Element Properties Editor in Grup
- Interpolate dimensions from DTMs declared as point clouds
Wizard to reallocate component Ids - Reorient pipe routing to reduce negative flow events
- Complete the Nodal Demand Editor to assign to nodes the declared consumptions by polygons or linear sections.
- Classify nodes and lines by sector in the Label field.
- Increase model data verification and debugging options.
Compatibility of scenario files with EPANET files.
- Improve modelling of load break reservoirs and small reserve reservoirs.
- Implement emitters with variable exponent at node level.
- Extend the characterisation of pump and valve behaviour curves. Default curves.
- Incorporate turbines as energy recovery elements.
- Link pumping energy consumption with solar photovoltaic production.
- Treat pollutant injection points as objects with their own Id, unlinked to nodes. Create a specific editor for their attributes
- Improve all iconography: buttons, components, symbology, etc.
- Symbolise transmitter nodes with a different icon.
- Apply zoom options to the display of components.
- Differentiate transport, arterial and distribution networks.
- Make QGIS symbology and layer viewer compatible with QGISRed symbology and layer viewer
- Generate thematic maps based on the properties of the elements: diameters, materials, age, roughness, dimensions, etc.
- Develop your own legend editor
Streamline the representation of results and improve navigation on the map. - Complete the options to evaluate maximums, minimums, ranges, averages and deviations of the results.
- Develop evolution graphs for one or more variables.
- Display results for intermediate events in the temporal graphs.
- Develop new windows and layers to visualise and analyse results
- Develop tools to compare field data with calculated values and to produce own calibration reports
- Compare the results of different scenarios with each other
- Enhancing topological exploration tools.
- Working with trees
Develop tools to help manage flow paths in a network. - Carry out hydraulic balances by sectors and display them in diagrams.
- Identify the origin and destination of the energy consumed
- Carry out energy balances by sector and display them in diagrams
- Show graphically the flow paths through pipes
- Identify the upstream and downstream zones of any node
- Perform material balances by sectors and show them in diagrams
- Identify zones of influence of different sources of supply
- Superimpose the sources of origin for the total substance arriving at a junction at an instant in time
- Superimpose the quality analysis for different non-reactive substances on each other
- Create a Service Connection Manager to carry out demand assignment and other types of mass operations related to them.
- Complete the allocation of demands to service connections from periodic billings.
- Create a Manual Valve Manager to perform all types of mass operations with the valves
- Connect the model with the historical status of the shut-off valves.
- Complete the identification of shut-offs (shut-off polygons) and create data structures associated with shut-offs
- Connect the model with the history of shutdowns. Dynamise the isolation of sectors
- Complete the characterisation of demand sectors and create associated data structures.
- Link simulations for extended periods to real data, and evaluate KPIs for these periods.
Add household meters as a new component of the Twin. Create a Meter Manager - Adjust demands to injected flows by sector. Consideration of hourly remote metering.
- Distribute latent leakage between network nodes and service connections.
- Adding point leakage as a new element of the Twin. Create a Point Leakage Manager.
- Incorporate new laws to characterise leakages
- Customise the parameters of pressure dependent demand curves (PDD) at node level.
- Incorporate new behavioural laws for PDDs
- Incorporate household cisterns as new elements of the Digital Twin
- Incorporate other elements to the Digital Twin, such as hydrants, hydrants, filling and emptying valves, suction cups, etc.
Version history

The process of developing a software product is complex and requires many hours of dedication and code review. From the initial conception of a procedure to its final implementation there are many intermediate tests, and in the end errors always arise where they are least expected. With each new version, attempts are made to introduce new capabilities, but at the same time it is inevitable that errors in what appears to have already been consolidated will have to be corrected.
The following is a list of the advances and corrections made in the successive versions of QGISRed, since version 0.6 was first uploaded to the QGIS repository.
- Improvements to the Project Manager. New buttons for moving and exporting projects, and new options for renaming projects.
- Identification of all layers managed by QGISRed using a unique ID, rather than by name, enabling work in multiple languages.
- Revision of the map symbols, labels and warnings associated with all layers managed by QGISRed.
- Greater integration of the Element Properties Editor, maintaining layer properties and refreshing data in all affected windows, including the attribute table.
- Storage of the style of all layers managed by QGISRed in .qml files at three levels: default, user level and project level.
- Storage in a dedicated table of all measurements handled by QGISRed, specifying the units and decimal places to be displayed in the various unit systems and according to specific cases.
- Creation of a dedicated Legend Editor to customise ranges or classes, colours and sizes of all legends handled by QGISRed.
- Wizards to customise legends automatically.
- Addition of a new menu and a new toolbar to house new options for querying data and results.
- Reorganisation of the layers in the Queries group, and of the storage of the corresponding SHP files within the project’s folder structure.
- New tool for locating any element on the map using its ID and identifying connected elements, with the option to navigate between them.
- New panel for viewing the data and results of any selected network element. Synchronisation of results with the current point in time of the simulation.
- New dialogue box for creating thematic maps of certain parameters associated with the different types of elements managed by QGISRed.
- New panel for locating elements on the map that meet specific criteria relating to data or results. Synchronisation with the results for the current simulation time.
- Improvement to the format in which the INP file is exported from QGISRed, similar to that exported from the EPANET Toolkit.
- Replacement of the EPANET 2.2 calculation engine with the new version 2.3, up to the latest revision 2.3.5.
- Reading of simulation results directly from EPANET binary files for faster and more responsive navigation.
- Incorporation of the Status Report into the results panel in a new tab, always accessible.
- Export of all simulation results to a structured CSV file.
- New option to display various statistics on the results throughout the entire simulation period.
- New window to display the time-series curve for any parameter of an element throughout the simulation period. Option to overlay multiple curves for the same or different parameters.
- Improvements to the Demand Builder for point demands. Revision of algorithms and automatic loading of links. New theme for demand points.
- Revision of the tool for identifying hydraulic sectors and detecting isolated consumption points.
- Revision of the algorithm for identifying blockages. Detection of isolated consumption points.
- New project-level options to transfer demand from connections to nodes. Classification of demand by patterns.
- Compatibility of version 0.18 with the new versions of QGIS 4.0.
- Translation of all QGISRed dialogues, panels, messages and layer names into Spanish.
- Redesign of all icons managed by QGISRed with a more uniform and appealing appearance.
- Web hosting of the provisional QGISRed manual in English and Spanish for online consultation via the collaborative platform GitBook.
- Acknowledgement to the Inter-American Development Bank (IDB) for its financial support for all the improvements made in this version 0.18.
- Resolved an issue when loading field data related to the decimal separator.
- Fixed a bug that prevented the cancellation of requests for areas that remain isolated.
- Limit on the size of the ‘Description’ field, used to provide information on the load demands on each node.
- Incompatibilities with the latest versions of QGISRed, up to 3.44, have been resolve
- Replacement of version 2.2 of the EPANET Toolkit with the new version 2.3
- New exploration tool to identify isolated segments, highlighting affected manual valves and service connections
- Display of up to 13 statuses for pipes, valves and pumps in the results
- Transfer of statuses and qualities for chaining successive simulations
- New options for resetting roughness, elevations and diameters in the scenario builder
- New option to export and import scenarios in Epanet format
- Projects listed in the Project Manager can now be temporarily reordered by attributes by clicking on headers
- New options in the Project Manager to Rearrange, Export, Delete and Rename projects
- New tab in the Import dialog to import QGISRed projects
- New buttons and menu options for opening and saving projects
- The path of the .qgz file is now stored as a relative path in the metadata.txt file
- If the associated .qgz file is not found when opening a QGISRed project, the option to search for it is now offered
- When opening a .qgz project directly from QGIS, it is automatically added to the Project if it is a QGISRed project Manager
- Changes to the icons and names of some menu options
- Changes in symbols used for some elements: nodes with demands, multiple demands, emitters and quality sources
- The layers in the Input group are now automatically reordered
- The number of elements contained in each layer is now displayed next to its name
- All elements now display their ID when the mouse is hovered over them
- The default notification of the presence of pumps or valves with a free end has been removed
- The precision when entering certain numerical values in shapes has been improved
- The message when downloading the necessary dependencies have been reviewed
- The ‘metadata.txt’ file now always closes when opened from the About dialog
- The default tolerance when creating a project or importing shapes is now 0, to avoid strange behaviour in WGS84 coordinates
- Removed the default creation of the Signals.dbf file when creating a new project
- Removed the unexpected creation of the Service Connection theme when performing some graphic editing operations
- Extended the curve plots of pumps declared by 3 points to the entire quadrant
- If the material of a pipe is declared and the installation date is omitted, its roughness is determined as if it were new
- Fixed a bug that prevented adding pumps and valves on nodes with a connectivity degree of two
- Fixed a bug when displaying the default modulation curve in the pattern dialog, and when declaring or modifying it in the analysis options
- Fixed a bug in storing the installation date of shut-off valves
- Fixed a bug in interpolating elevations when the point falls on one of the ends of the mesh
- Fixed a bug when distributing demands in proportion to pipe lengths
- Pump and valve ends are excluded in all options when assigning demands to nodes from the Nodal Demand Builder or from Service Connections
- Fixed a bug that prevented demands from being superimposed on the same node when assigning Punctual Consumptions from the Nodal Demand Builder
- Fixed a bug when loading demands from a sector layer
- Fixed a bug that confused the price pattern with the speed pattern when reading the INP file
- Fixed a bug when importing INPs with sources without defined pattern
- Fixed a bug when importing INPs related to Times and Temporary Rules
- Fixed a bug when reading the LABELS section of an INP, which differentiated between uppercase and lowercase letters in keywords
- Fixed certain errors in importing/exporting curves and patterns related to the decimal separator
- Fixed a bug with decimal symbol in PDA model options
- New options in the nodal demand manager to declare consumption for the whole network or by zones.
- Ability to export, edit and re-import links between point consumption and nodes
- New options to import/export/delete demand scenarios by categories
- New tools in the Nodal Demand Manager to consider water efficiency or assign consumption patterns by sector.
- New Scenario Manager to store and retrieve various model parameters in bulk.
- Automatic calculation of pipe lengths from vertex coordinates.
- Automatic completion of service connection routing by means of a perpendicular section to the nearest pipe or a link to the nearest junction.
- Possibility of automatically tracing connections of a pre-set length from a point on a pipe or a junction.
- New option to mirror a service connection with the invert tool.
- New option to import service connections as points, creating perpendiculars to the nearest pipe or node connections.
- New IsActive field in service connections to define if it is operational or not.
- Verification of the point of contact of a service connection with a pipe or node at both ends.
- Before calculating the hydraulic sectorisation, the status of the manual valves is now transmitted.
- When exporting to INP the loss coefficient of the shut-off valves is transmitted to the pipes.
declaration, editing and deletion of meters of various types as new elements of the Digital Twin - Editing, reading and saving of signals associated with meters
- New dialog to read field data and export to CSV the data corresponding to the simulation interval.
- New option to export the field data, together with the INP file.
- New fields in the import dialog to be able to import more information of the elements.
- New option to show in the auxiliary themes the elements with some incidence, during the shapefile import process.
- New buttons and a new slider in the results panel.
- Improvements in the labels to show the results
- New type of result to display the status of the lines.
- Improvements in the search from the properties editor.
- When exporting the INP, new drop-down with paths to EPANET executables found, to automatically open the exported file.
- When importing an INPs file, patterns are now sorted by their type
- New warning when autocompleting the ID of some element
- Changes to the order and names of some toolbar buttons
- Changes in the visual styles of some of the elements
- New link to QGISRed website in the info window
- Fixed reading the curve ID in GPV valves and editing it from the element properties window.
- Fixed an error when assigning default values in the import of the reaction coefficients in water and in walls
- Fixed a bug and message displayed when reading pollutant sources in tanks and reservoirs
- Fixed an issue that caused point selection tools to stop working for certain elements
- Fixed a bug with the mass T-connection creation tool
- Fixed a bug with the multi-selection tool
- Fixed a bug with the polygon selection tool, when the reference system was not the default one assumed
- Fixed a bug with the snapping tool (point selection of elements) in QGis version 3.26
- Management of manual valves (import, creation, deletion, editing of properties, interaction with pipeline status…)
- New tool for changing the status of linear elements and manual valves
- New symbolisation of pipes, pumps, control valves and manual valves according to their status.
- Cancellation of isolated demands due to closure of overlapping pipes or valves during simulations
- Assignment of demands to nodes from demand sectors and point demands with various options
- Improved property editing window (multiple selection, connected elements, visited elements, centre selected element)
- Revision and extension of the analysis options (hydraulics, quality, time and energy).
- Incorporation of new Epanet 2.2 parameters in forms (tank overflow, pressure dependent demands)
- Highlighted main toolbar buttons/menus
- Default and only English language (for now)
- Improved editing of rules (with times and clock times)
- Fixed bug when typing demand values with more than 4 digits to the left of the decimal point
- Fixed bug with time labels for selecting results
- Fixed bug when converting numbers in the dimension interpolation process
- Fixed bug with reading and writing rules
- Fixed bug with the order of rules
- Fixed bug with rules using comma as decimal separator
- Fixed problem when assigning the project projection
- Fixed bug with editing properties when working with raster layers
- New tool to edit service connection geometry
- Prioritisation of Digital Twin elements when selecting objects for editing properties or deleting objects
- Hydraulic Demand Multiplier option now supports a value with decimal places
- Display of user-defined decimal separator in different plugin windows
- Fixed severe bug when reading metadata from previous models, which prevented working with them
- Fixed a bug when installing the plugin without having the necessary dependencies in advance
- Fixed bug when interpreting the time format in simple control laws
- New menu to group the tools for the management of Digital Twins.
- Creation of connections through its own tool, and their incorporation into the deletion tool.
- Specific tab to edit the properties of the connections.
- Loading of automatic meter readings (remote reading) in different formats, to the connections or nodes of the model.
- Addition to the modulation curves editor of the demand curves in the service connections.
- New demand manager to complete the import from file, export to file and selective deletion of the base demands in the nodes and their modulation curves.
- Improved access times to the element properties editing window for large networks.
- Opening the INP file from the EPANET interface when exporting is now optional.
- New options for defining units and pressure drop formula when importing data from GIS
- Loss coefficient converter when changing formula, checks for declared pipes beforehand
- Corrected formatting of time options to allow entering days in addition to hours, minutes and seconds
- Removal of modulation curves on multiple demands is now limited to removed demands only
- Fixed reading of dates in metadata
- Fixed bug that prevented importing SHPs when selecting the same field for different properties
- Fixed bug where some fields in SHPs were imported without being explicitly selected
- Translation to English of some texts that were only displayed in Spanish
- Fixed bug in graphical selection tools when QGIS CRS is different from QGISRed data
- Fixed SHP import error when a feature does not have its geometry declared
- Fixed a visualisation error in result layers
- Edition of the material-roughness table for the calculation of the roughness depending on material and age.
- New import and export of patterns/curves in CSV format
- New tool to import base demands at nodes and Ids of modulation curves (single or multiple) from a CSV file.
- Import of connections from SHP
- New tool to obtain the minimum resistance tree of the network
- Upgrade of EPANET library to version 2.2
- Improved interface for converting roughness coefficients
- Fixed a bug in displaying Quality results
- Refreshed current units and loss formula in status bar when loading a QGIs project
- Projects imported from INP are now displayed in the project list
- Correction of an error when nodes have no coordinates
- When inserting valves or pumps in pipes, negative lengths are now avoided
- Fixed an access error when the Pattern TimeStep is 0:00
- Connections are now read correctl
- Creation of a Json file to define the different projections (content of the .prj) in case of no Internet availability.
- Implemented reading of the PUMPS section formats inherited from EPANET version 1.1
- New single installer for both architectures (x86 and x64)
- Displayed units and pressure drop formula in the status bar.
- Roughness coefficient estimation as a function of age and material supports different pressure drop formulas and unit system.
- Roughness coefficient conversion between different pressure drop formulas
- Tool to create a backup copy of the project (manual restore)
- Fixed bug when loading the plugin in QGIs version 3.14.15
- Fixed bug for not allowing to express hours in other format than AM/PM in Controls section
- Fixed a bug when not being able to access the Windows user information on some computers.
- New blue colour in labels for line type results
- Fixed error when cloning project and losing metadata
- Fixed error when saving a results scenario and freezing the map
- New alphabetical order of link and node lists in Simple Controls
- Fixed abnormal behaviour of the create/import tool when other layers are open.
- INP file section headers are now written in English.
- Validated element properties to prevent lines from having both end nodes with the same ID
- Fixed a bug when importing repositories
- Improved vertex simplification to remove repeats at the starting point
- Fixed a bug when writing Timing Options
- Metadata has been restructured, and unified in _Metadata.txt file
- Fixed a bug in joining pipes with the same characteristics, when they start and end at the same node.
- Now it checks if a new version exists and notifies the user.
- Fixed display of icons in the legend for QGIS version 3.12
- Fixed a bug that prevented storing the styles for results
- Fixed a bug in the reading of the decimal separator when the user uses the English format and changes the decimal separator by comma
- LayerManagement can now be accessed from EditProject to control layer visibility and creation of layers
- Projection is now stored correctly in .prj files.
- New Project Options window
- Import (without project – INP or SHPs) and Add data (with project – only SHPs) operations have been separated.
- Special tolerance when importing/adding SHPs has been added.
- The Manual now includes the format of the ASCII files for interpolating elevations and the classification of the 4 types of hydraulic sectors.
- The four layers reserved for the gauges have been merged into one layer
- Fixed a bug when writing the SHP of valve and pump events.
- The methods for assigning roughness and for checking the overlapping of elements, the alignment of vertices, lengths, materials, diameters or date of installation, now apply only to selected elements
- Fixed a bug in a very particular case, when creating individual T-connections
- New handling of dependencies to avoid errors when in use
- New logo for QGISRed plugin
- Easy creation of pipes, tanks and reservoirs with own tools, and options for anchoring to existing elements.
- Tool to edit the layout of linear elements, including the creation (click on the layout), displacement and deletion (right button) of vertices.
- Default orientation of valves/pumps when inserting them into a pipeline, following the pipeline’s layout
- Tool for reversing the orientation of linear elements (pipes, valves and pumps)
- Tool for splitting and joining pipes
- Tool for splitting/joining nodes
- Tool for creating/undoing T-connections
- Tool for creating/undoing pipe crosses
- Tool for repositioning valves and pumps
- Multiple selection of elements from different layers in one step (Ctrl add and Shift delete)
- Deletion of all selected elements within a polygonal region
- Removed most of the double buttons and replaced by a new option in the dialogue window.
- New button to access the last results without simulating again.
- Ability to expand and collapse the results pane to allow docking of other QGis windows
- Fixed a bug when working with long file paths.
- Several improvements on features already offered in previous versions.
- Editing the network layout, allowing nodes to be moved so that the rest of the piping connected to it follows it
- Insertion/removal of valves and pumps in the pipes, incorporating or eliminating at that point a small section and two nodes at their ends.
- Dialogue for editing the default values, classified by categories
- Properties Editor for the basic elements of the network (pipes, nodes, tanks, reservoirs, valves and pumps), being able to navigate between the different elements of the model.
- Assignment of default values when creating elements (ID and properties)
- ID control, filters for all numeric fields and drop-down menus for listed fields
- Modulation curve and/or behaviour curve selector, including declaration of modulation curves, from the property editor
- Emitter editor integrated in the property editor for demand nodes
- Multiple demand editor, integrated in the property editor of the demand nodes. Display as a separate layer
- Pollutant source editor, integrated in the property editor of the node elements. Visualisation as a separate layer
- Editor of calculation options, classified by groups (hydraulics, time, energy, quality, reaction, reports, funds).
- Table of roughness and coefficients of growth with age. Wizard to assign roughness to pipes according to material and age.
- Rearrangement of the application buttons into 5 categories, to facilitate the handling of the different options.
- Dialogue for editing the analysis options, sorted by groups.
- Verification of possible repetition of Ids in the generation of new items
- Hiding of the data tables in the layer viewer for Patterns, Behaviour curves, simple and rule-based control laws, analysis options and default values.
- Changes in the results panel to select a single variable per node or per line to be displayed, reducing the refresh time.
- Option to display the value of the chosen variable for each element using static labels.
- Removal of administrator permissions to install the required dependencies.
- Fixed some errors when reading control laws.
- Other improvements over the features already offered in previous versions
- Window with the summary of the most relevant data of the project.
- Pattern editor, with classification by type, visualisation of the associated elements, and alternative editing by real values or by coefficients.
- Behavioural curve editor, with classification by type and automatic adjustment of the declared pump curves with one or three points
- Editor of simple control laws, with line and node selector, syntax options selector, and editing of comments.
- Control rule editor, with line and node selector, syntax option selector, and a combined condition and performance manager.
- In addition, some improvements have been made to features already released in previous versions.
- Project Manager. From it it is possible to open, create, import, clone or delete projects.
- Creation or edition of a QGISRed project. Vectorial layers (shp) of the basic elements that EPANET works with can be created. If the user deletes any of the shp layers, it is possible to create them again.
- Import data from an INP file (EPANET) or from shp files. Under the first format it is possible to import complete models developed with the well-known EPANET software. With the second format it is possible to create or complete a model specifying for each type of element the shp file from which the information has to be imported and the fields where the required data reside.
- Validation of the model, informing if there are any errors or warnings when processing the information contained in the shp files.
- Export the model to an EPANET INP file, with the option to open it with this application once the file is generated.
- Simulation with the EPANET Toolkit to show the hydraulic and quality results.
- Incorporation of a message warning of the release of new versions, from the QGISRed add-on window
Minor improvements and bug fixes
In addition to all of the above, version 0.17 continues to refine existing QGISRed features. For example: Various corrections have been made in reading the INP file, etc. If you want to learn more about all the minor improvements and
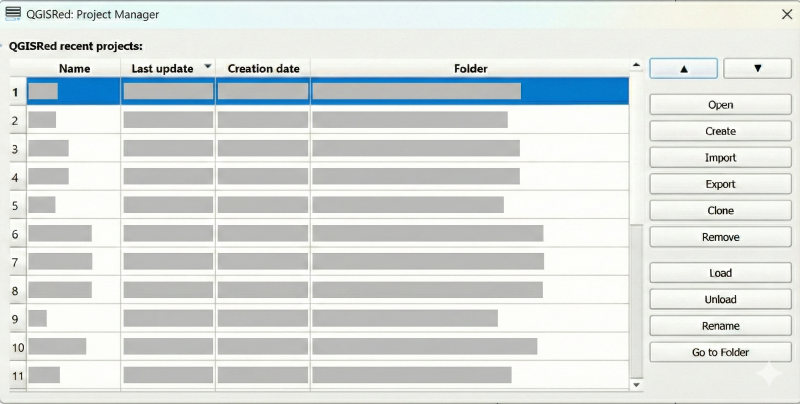
New options in the Project Manager
The QGISRed Project Manager is one of the most widely used tools by QGISRed users, as it allows easy switching between scenarios. In daily use, you may have missed some options that version 0.17 now completes. First, you can now
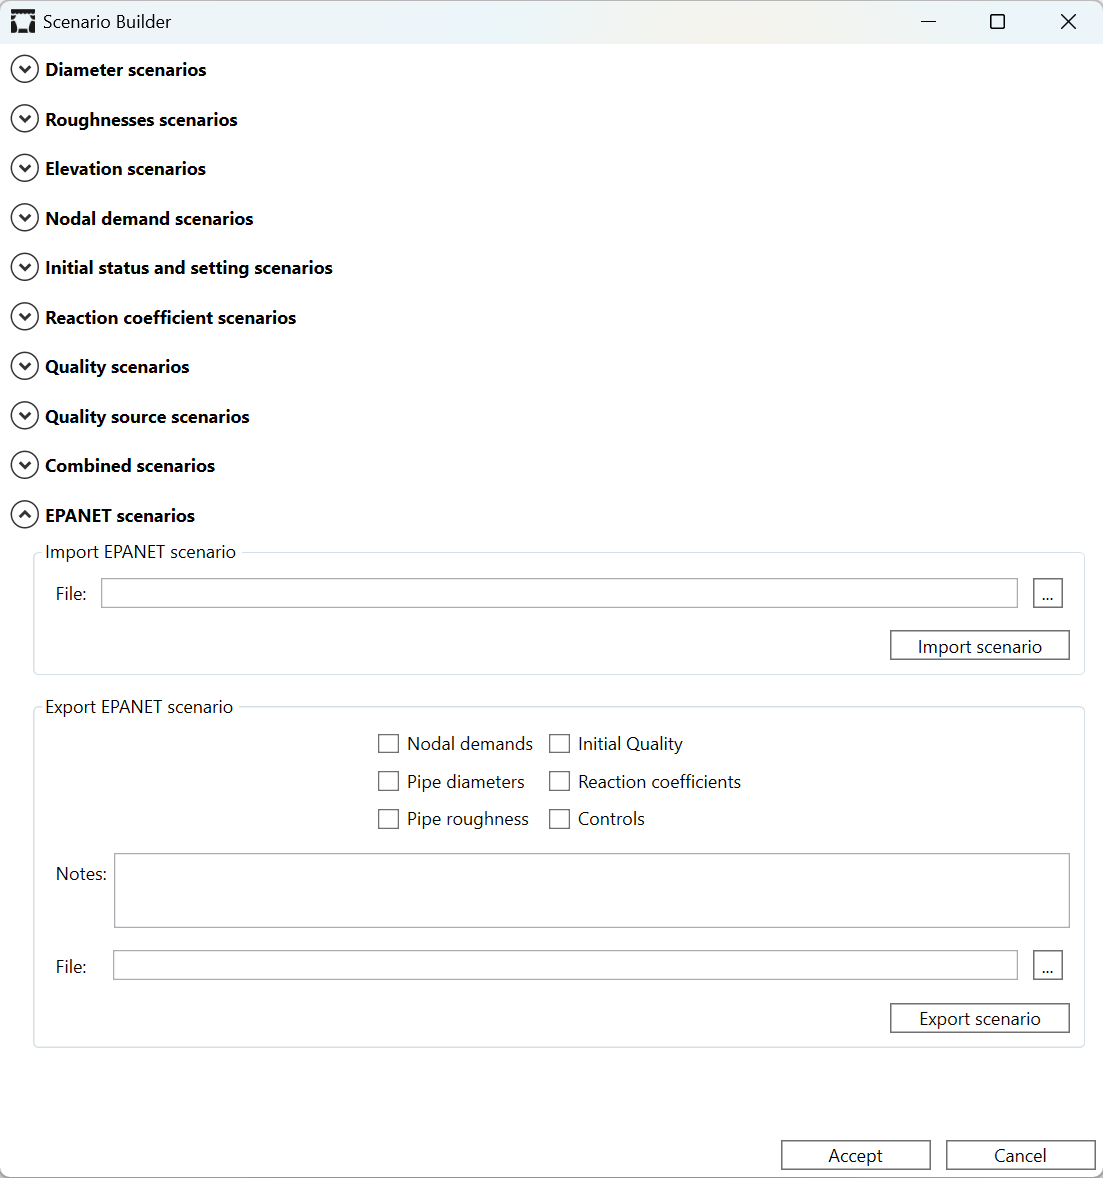
Scenario Manager compatible with EPANET
EPANET includes an option to export and import scenarios, although it has been little used by users. Specifically, it allows exporting pipe diameters and roughness, node demands, initial quality, reaction coefficients, and control rules into different text files, which can
Chaining successive simulations
You may never have considered running simulations beyond 24 hours or one week. Why would you? As more real data becomes available, we have the opportunity to better adjust models to reality, and in practice no two days are the

Identification of up to 13 statuses in the results for pipes, valves and pumps
Do not confuse the initial state of an element declared in EPANET with its state at a given moment obtained as a result of calculations. The initial state of a transport element (pipe, pump, valve) can be Open, Closed, or
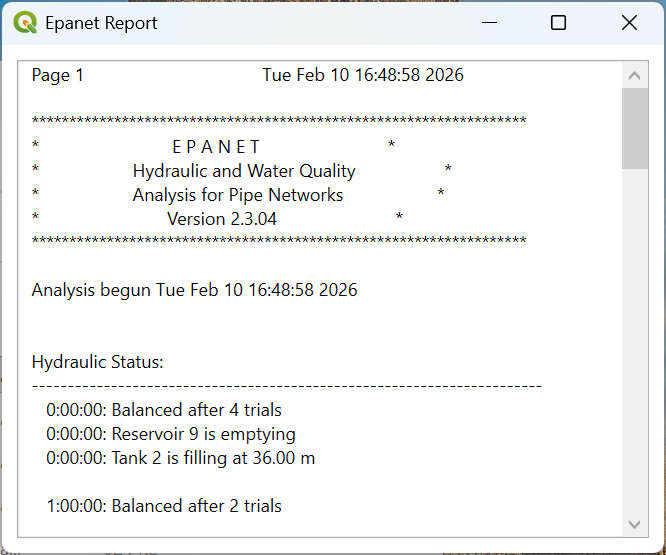
Integration of EPANET Toolkit version 2.3
The EPANET Toolkit version 2.2 was released in 2019 and was incorporated into QGISRed in its early versions. Over the following five years, many improvements were made to the Toolkit, although its consolidation was slow. Finally, in July 2025, the
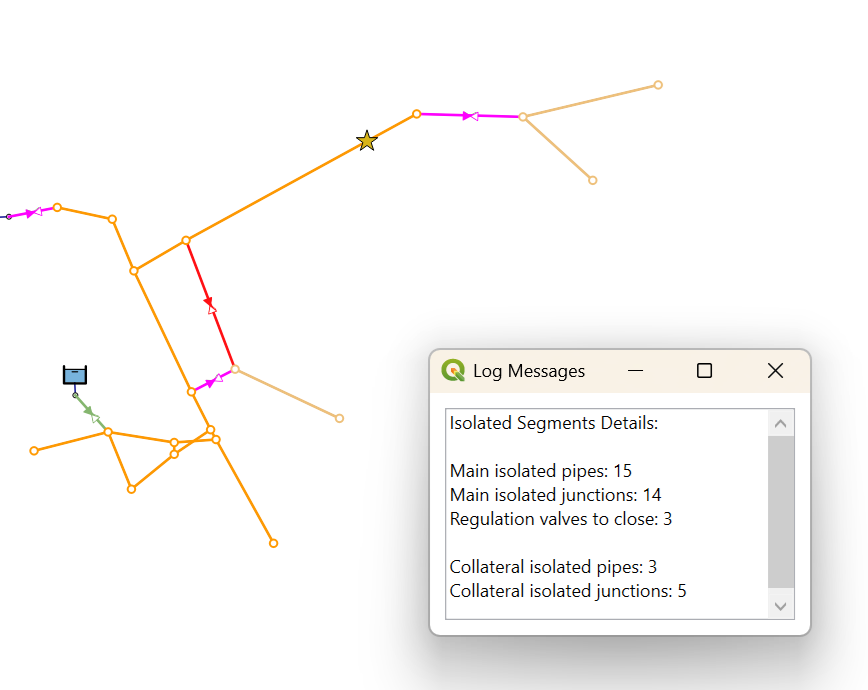
New isolated segment exploration tool
One of the most requested features in urban water distribution network simulation software is the determination of which valves must be closed to isolate a network segment around a failure point, or where works are to be carried out to
Debugging and Enhancement of Previous Performances
In addition, some aspects of the previous versions have been improved in version 0.16, e.g. the timeline and dropdown menu for selecting when to observe the results, the order and classification of some menu options, new fields when importing shapes,
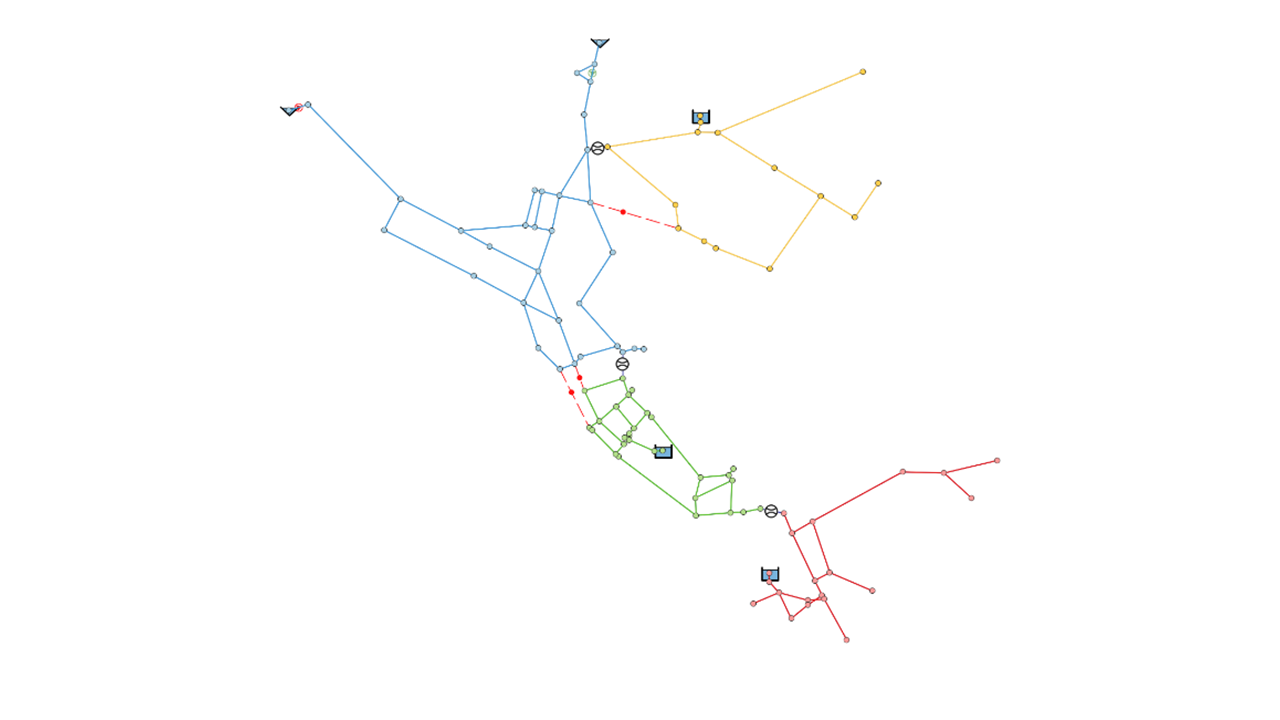
Identification of Demand Sectors (DMA)
The first versions of QGISRed already offered the possibility to identify the demand sectors via the Tools menu. It was necessary to close the boundary pipes and manually set a flow meter on the pipes left to feed the sector.
Adding Meters to the Model
One of the most important features required for the hydraulic model of a network in service is that it faithfully represents reality, and to get it the hydraulic variable must first be measured. In QGISRed, gauges are treated as objects