
The first versions of QGISRed already offered the possibility to identify the demand sectors via the Tools menu. It was necessary to close the boundary pipes and manually set a flow meter on the pipes left to feed the sector. From version 0.15 onwards it is now possible to declare the isolation valves over the pipes or nodes, and with version 0.16 we can now declare flow meters and counters on the pipes using the Add Meter tool.
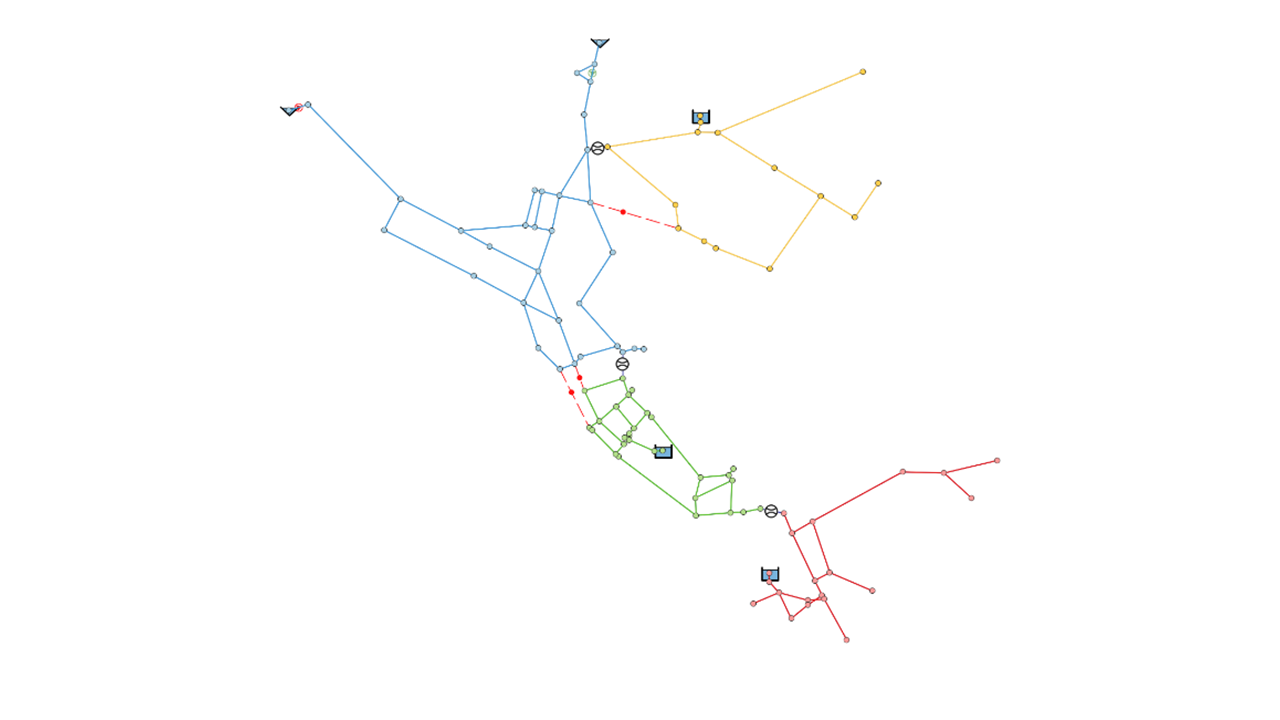
Select the strategic pipes of your network (the image of the banner corresponds to Net3) where you want to place the isolation valves to separate the sectors, create these valves and then close them using the Touch tool; at the same time, the pipes below will also be closed. Now select the pipes with the larger diameter that will feed the sector (or will leave it) and place the flow meters on them. Once you have correctly placed the closed valves and the flow meters, when you invoke the Obtain Demand Sectors tool in the Tool menu, you will immediately see in the Queries Group the Demand Sectors (DMAs) identified by QGISRed, each in a different colour.
If the network is somewhat complex, you may not initially get what you expected; you probably forgot to close a pipe or add a flow meter. Correct this and try again. With QGISRed, you can easily open and close valves and enable and disable meters to quickly change the configuration of demand sectors until you get the sectorization you want.
QGISRed does not yet offer the automatic sectorizaton according to specific criteria, nor does it offer too much information about each sector. But the current tool is already an important step because in very meshed networks it is not easy to ensure that the only entry and exit points of each sector are those where a flow meter is located. In future versions, we will further improve this tool.
To learn more about how to use this very useful tool visit the Tutorial….