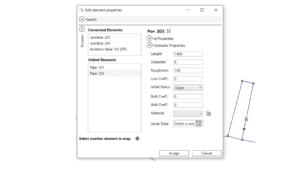
The service connections in QGISRed are differentiated elements of the pipes, forming part of the Digital Twin, and have a linear layout. How to add, edit or delete a service connection and how to edit its properties have already been discussed in an earlier section.
However, in many utilities, the layout of service connections is not mapped. At best, only its connection point to the pipe is known, or the location of the service point that separates the part of the connection managed by the utility from that privately owned. Without other information, many choose to draw a perpendicular line from that point to the nearest pipe or simply a perpendicular line from the connection point, replacing the real service connection. But how many connections are there in a network? Probably more than pipes. And do you have to trace the connections one by one looking for perpendicularity? Not in QGISRed.
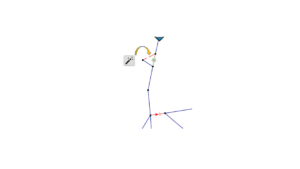
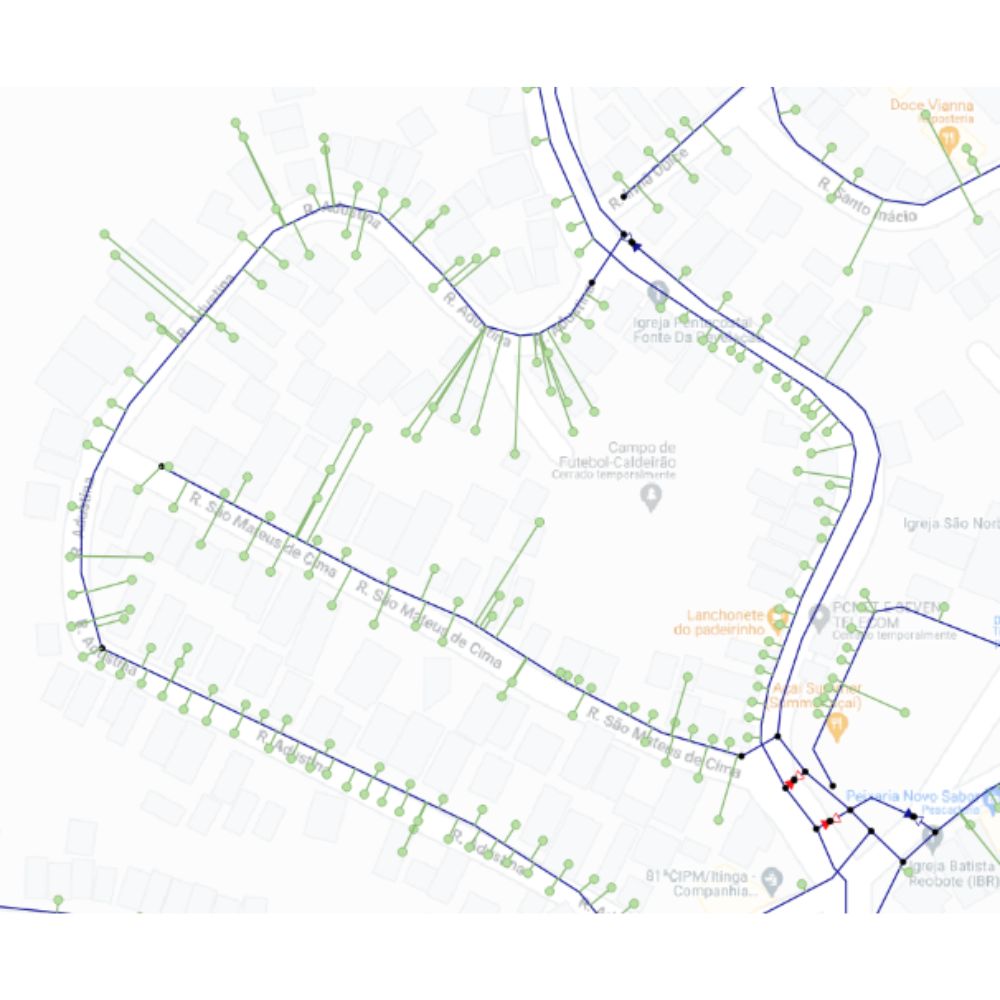
In version 0.16, we have added tools to help you automatically draw the service connections from the service point near a pipe by inserting the perpendicular to it. And if the base of the perpendicular is outside the segments of the polyline that represents the pipe, it will search for the nearest node or vertex. In addition, we have also considered the possibility that the service point is located above a pipe or a node. You will be surprised how many situations we have considered for the automatic tracing of the service connections, both to complete the tracing when you proceed one by one and when you want to trace them all automatically from the import of a service points layers.
Do not miss the tutorial….. to learn all the options considered in QGISRed, so that routing the service connections will not be a problem and you can proceed with building a Digital Twin, where these components are the links that connect the model with the customers’ consumption.